-
Bug
-
Resolution: Duplicate
-
Low (View bug fix roadmap)
-
None
-
6.7.7
-
None
-
6.07
-
Version Report graph does not show 100% completion when all Story Points are Done. For example, from the default generated Sample Scrum Project:
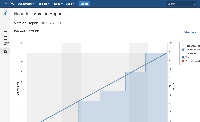
- The version has 8 out of 8 story points complete.
The Graph accurate depicts the Story Point axis on the left with 8 Story Points complete, but the Percentage is incorrect. The Percent axis on the right shows 90%, where 100% would be expected.
I've run multiple tests with different versions and projects and the results are the same, where the percentage does not reach 100%.
Steps to reproduce:
- Generate the Sample Scrum Board for JIRA Agile
- Navigate to Version Reports
- Check the different versions and observe the graphs
- Compare to the list of issues, notice that all stories are complete, but the graph never reaches 100%
- is duplicated by
-
JSWSERVER-12137 Version Report does not do correct measurement for Users' Progress
-
- Closed
-
[JSWSERVER-12265] Version Report Does not 100% when all Stories are Done
Minimum Version | New: 6.07 |
Workflow | Original: JAC Bug Workflow v2 [ 2853547 ] | New: JAC Bug Workflow v3 [ 2935484 ] |
Status | Original: Resolved [ 5 ] | New: Closed [ 6 ] |
Workflow | Original: JIRA Bug Workflow w Kanban v7 - Restricted [ 2539937 ] | New: JAC Bug Workflow v2 [ 2853547 ] |
Workflow | Original: JIRA Bug Workflow w Kanban v6 - Restricted [ 1545742 ] | New: JIRA Bug Workflow w Kanban v7 - Restricted [ 2539937 ] |
Labels | Original: pse-request | New: affects-server pse-request |
Workflow | Original: JIRA Bug Workflow w Kanban v6 [ 914815 ] | New: JIRA Bug Workflow w Kanban v6 - Restricted [ 1545742 ] |
Resolution | New: Duplicate [ 3 ] | |
Status | Original: Open [ 1 ] | New: Resolved [ 5 ] |
Labels | New: pse-request |
Description |
Original:
Version Report graph does not show 100% completion when all Story Points are Done. For example, from the default generated Sample Scrum Project:
!default sample scrum project.png|thumbnail! * The version has 8 out of 8 story points complete. The Graph accurate depicts the Story Point axis on the left with 8 Story Points complete, but the Percentage is incorrect. The Percent axis on the right shows 90%. I've run multiple tests with different versions and projects and the results are the same, where the percentage does not reach 100%. |
New:
Version Report graph does not show 100% completion when all Story Points are Done. For example, from the default generated Sample Scrum Project:
!default sample scrum project.png|thumbnail! * The version has 8 out of 8 story points complete. The Graph accurate depicts the Story Point axis on the left with 8 Story Points complete, but the Percentage is incorrect. The Percent axis on the right shows 90%, where 100% would be expected. I've run multiple tests with different versions and projects and the results are the same, where the percentage does not reach 100%. Steps to reproduce: * Generate the Sample Scrum Board for JIRA Agile * Navigate to Version Reports * Check the different versions and observe the graphs * Compare to the list of issues, notice that all stories are complete, but the graph never reaches 100% |