-
Type:
Bug
-
Resolution: Duplicate
-
Priority:
Low
-
Affects Version/s: 4.2.1
-
Component/s: None
-
4.02
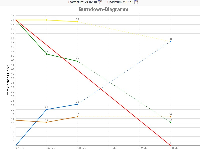
- no matter which end-date you set on a version, the chart always shows an additional day at the end
The reason for this seems to be the fact that the chart assumes that the work done a day lowers the "starting values" for the next day. The effect is that things done on a day (the burndown of that day) is actually reflected on the following day, which is incorrect!
- duplicates
-
JSWSERVER-1947 Trend lines should (optionally?) start from the previous day
- Closed
