-
Type:
Bug
-
Resolution: Fixed
-
Priority:
Medium
-
Affects Version/s: 3.13.0, 3.15.0, 4.5.4
-
Component/s: Reports
-
10
-
Severity 1 - Critical
-
31
Summary
The workload reports page shows list of agents, their assigned issue counts and number of breached and ongoing issues.
To find the breached and ongoing issues we completely calculate everything to do with SLAs leading to slow performance.
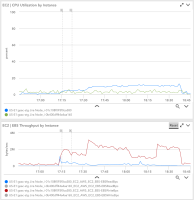
The configuration in the attached screenshot took 23 seconds to load.
Steps to Reproduce
- Try to load a Workload report
Expected Results
Report loads in a reasonable time
Actual Results
Report take a very long time to load like ~30secs
Notes
For all issues that have an assignee, we loop through all SLAs, and get goalSummaryData.
In getting goal data, we retrieve everything about ongoing goals, including expected breach date that gets active ranges in nested loops. This is already O(n^4). It's possible that there is a worse flow.
- is related to
-
JSDSERVER-6808 Slowly typing query into JSD Project Workload search causes service unavailability
-
- Closed
-
-
JSMDC-2946 Loading...
- relates to
-
JRASERVER-70934 Requests to `/jira/rest/internal/2/user/mention/search` where the parameters do NOT include a query are very slow
-
- Closed
-
-
JSDSERVER-6808 Slowly typing query into JSD Project Workload search causes service unavailability
-
- Closed
-
- causes
-
ITOPSENG-567 Loading...
- links to


