-
Type:
Bug
-
Resolution: Fixed
-
Priority:
Low
-
Affects Version/s: 8.20.8, 8.20.15, 8.22.2, 9.1.0
-
Component/s: Dashboard & Gadgets
-
None
-
8.2
-
1
-
Severity 3 - Minor
-
3
Issue Summary
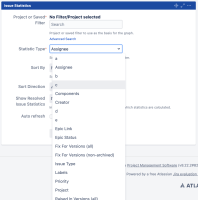
When editing gadgets that allow you to configure custom fields via drop-down box, it won't scroll through them, preventing the user from selecting the custom fields that doesn't fit on the screen.
Screen Recording 2023-02-15 at 17.58.08.mov![]()
Note:
The same happens for the Statistic Type on Pie Chart gadget as well as XAxis and YAxis fields on a 2D Filter Statistics. Other similar gadgets/fields may also be affected.
Gadgets showing this problem:
- Issue Statistics
- Field: Statistic Type
- Two Dimensional Filter Statistics
- Fields: XAxis, YAxis
- Pie Chart
- Field: Statistic Type
Steps to Reproduce
- Create a Dashboard.
- In that dashboard, add a gadget that uses the Statistic Type field. As an example, the Issue Statistics gadget.
- Create multiple custom fields so there are a lot of options for the Statistic Type.
- Alternatively you may reduce your browser window size so it would require scrolling with less fields.
- Click the dropdown to see the options available for the Statistic Type field.
Expected Results
A scroll bar is presented and you're able to scroll through the options.
Actual Results
There's no scroll bar and it is not possible to access all possible values for the dropdown.

Workaround
Workaround 1
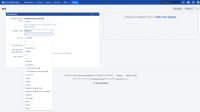
Zoom out the page to show more options:

![]() Note that this workaround will only work if the full list of available fields is small enough. If the list is huge (hundreds of fields), then it will not be possible to zoom out the browser to see the entire list.
Note that this workaround will only work if the full list of available fields is small enough. If the list is huge (hundreds of fields), then it will not be possible to zoom out the browser to see the entire list.
Workaround 2
If the workaround 1 is not an option (due to the huge list of fields), try this workaround instead, which consists in using the Browser Dev Tool to manually select the field of your choice.
Here are the steps:
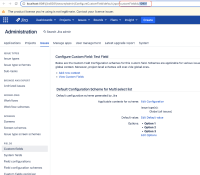
- Let's assume that you have 2 fields using the same name: Test Field in the page ⚙ > Issues > Custom Fields:

- Try to configure the field you are interested in (by clicking on "... > Edit" next to this field, and get the custom field ID from the Browser URL (in the example below, it has the ID 10901):

- Go to the Dashboard, add the Pie Chart (or any other statistics Gadget)
- Open the Browser Dev Tool
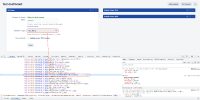
- Click on the Dev Tool tab that has a square and arrow icon, then click on the field next to Statistic Type in the UI. You will see the element corresponding to this field. Expand it to see the full list of available fields

- Scroll down until you see the field that you are interested in

- Double click on Value in the Browser Dev Tool, and add the following string right before the > icon, as shown in the screenshot below.
 Make sure to add a space before the 1st selected word. After you press enter, you should see that the field of your choice is automatically selected
selected="selected"
You can also see the workaround in action in the video below:
Workaround.mov![]()
- is duplicated by
-
JRASERVER-73265 Missing scrollbar in two dimensional filter
-
- Closed
-
- links to
- relates to
-
MNSTR-6258 Loading...
