-
Type:
Bug
-
Resolution: Duplicate
-
Priority:
 Low
Low
-
Component/s: Dashboard - Dashboards & Gadgets
-
None
-
Severity 3 - Minor
Issue Summary
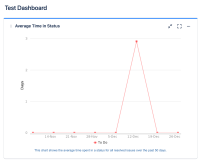
The Average Time in Status gadget shows erroneous result in graph.
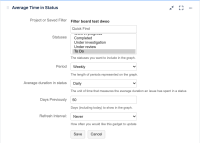
Steps to Reproduce
- Create a dashboard
- Add an Average Time in Status gadget to it
- Find an issue that was created in the current month and stayed in the selected status for longer than a day
- Create a JQL filter as: key = <issue key of the issue found>
- Use the filter above in the gadget
- Configure the gadget length of periods represented on the graph as daily
See example below:
- Filter used is:
key = RT2-6
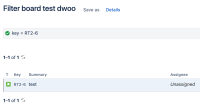
- Gadget is using status To Do
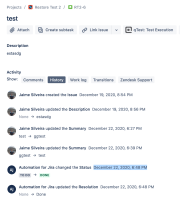
- RT2-6 was created on December 19, 2020, 8:54 PM and transitioned from To Do to Done on December 22, 2020, 6:48 PM.
- Graph displays values in the wrong period as screen-shot shows below:


Expected Results
Gadget graph would consider and display the values for the issue correctly
Actual Results
Gadget graph does not consider nor display erroneous values.
Workaround
Currently, there isn't one.


- duplicates
-
-
- Closed
-