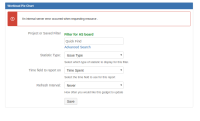
Summary

      Workload pie and Average Time in Status chart throwing "An internal server error occurred when requesting resource." 

      Steps to Reproduce

      1. Add "Workload pie chart gadget" or "Average time in status" to dashboard
      2. Select any filter -
      3. Cannot Save

      Expected Results

      1. Workload pie chart should appear

      Actual Results

      Update

      This only happens when the Issues in the selected filter/project do not have a value for the Time to report field on (eg. time spent).

      As soon as a value is added to the field, the error message goes away.

          Form Name

            [JRACLOUD-67143] Dashboard gadgets throwing error

            joe added a comment -

            Outside the original report, I don't see any mention of 'Average time in status' as being a problem; I'm treating this as only affecting the Workload Pie Chart.

            The issue here is that there is no data to show; but that doesn't mean it should be an error. Instead, it should show:

            No Data Available

            to make clear that either the query needs to be reconfigured, or there's simply no data here.


            joe added a comment - Outside the original report, I don't see any mention of 'Average time in status' as being a problem; I'm treating this as only affecting the Workload Pie Chart. The issue here is that there is no data to show; but that doesn't mean it should be an error. Instead, it should show: No Data Available to make clear that either the query needs to be reconfigured, or there's simply no data here.  

            Diego Alzugaray added a comment - - edited

            Please fix, reporting on time spent on projects has got to be one of the most fundamental use cases there are. Is there any work-around or app that will resolve this request?

            Diego Alzugaray added a comment - - edited Please fix, reporting on time spent on projects has got to be one of the most fundamental use cases there are. Is there any work-around or app that will resolve this request?

            Just faced this issue (shall I really tell our users "No need to worry, there is just no more work to do when the gadget shows 'Internal server error'" ) too.

            I can't believe that this was already reported in 2017

            Bernd Lorenz added a comment - Just faced this issue (shall I really tell our users "No need to worry, there is just no more work to do when the gadget shows 'Internal server error'"  ) too. I can't believe that this was already reported in 2017

            Lee Reyes added a comment -

            on add of gadget, this is prompted.

            can not edit and configure the gadget.

            Lee Reyes added a comment - on add of gadget, this is prompted. can not edit and configure the gadget.

            I face the same issue while pulling a filter in Pie chart under confluence macros.

            When can we expect a fix ?

            Sivasankar Raja added a comment - I face the same issue while pulling a filter in Pie chart under confluence macros. When can we expect a fix ?

            I am getting this error, as well.  Trying to track Issue Type and Original Estimate on a specific project.

            Chris Exley added a comment - I am getting this error, as well.  Trying to track Issue Type and Original Estimate on a specific project.

            I am getting this error when I set "Time field to report on:" on "Original Estimate".
            And values are setted for this field... So the update in the description is wrong.
            Please, correct it or give me a true workaround, I need this gadget!

            Sebastien Dorata added a comment - I am getting this error when I set "Time field to report on:" on "Original Estimate". And values are setted for this field... So the update in the description is wrong. Please, correct it or give me a true workaround, I need this gadget!

            I am getting this error as well, no matter what I select in the available fields.

            Carlos Pereira added a comment - I am getting this error as well, no matter what I select in the available fields.

            Petra von Thienen added a comment - - edited

            This error constantly occurs in the server and in the cloud version. I am filtering by project.
            Please ignore this comment, it works now.

            Petra von Thienen added a comment - - edited This error constantly occurs in the server and in the cloud version. I am filtering by project. Please ignore this comment, it works now.

            The error occurs just if selected "Time field to report on: Time Spent".

            Louise Leal added a comment - The error occurs just if selected "Time field to report on: Time Spent".

            Divya Dias added a comment -

            Why even show this gadget if Atlassian thinks this isn't priority? This bug was created back in 2017 and has no workarounds that has been specified. Assuming Verified status just means 'bug is accepted' since this is still reproducible.

            Divya Dias added a comment - Why even show this gadget if Atlassian thinks this isn't priority? This bug was created back in 2017 and has no workarounds that has been specified. Assuming Verified status just means 'bug is accepted' since this is still reproducible.

            +1 to me.  it looks to me a very obvious error which should be quickly fixed.

            Patrick Shih added a comment - +1 to me.  it looks to me a very obvious error which should be quickly fixed.

            Sentinel added a comment -

            Well, I'm facing this issue too. Wanted to test some staff on test env, but this error appears after saving changes for gadget in dashboard.

            Sentinel added a comment - Well, I'm facing this issue too. Wanted to test some staff on test env, but this error appears after saving changes for gadget in dashboard.

            Any word for Atlassian on this recently? I was really hoping to use this on my dashboard. Couldn't figure out what was doing wrong.

            Brandon Might added a comment - Any word for Atlassian on this recently? I was really hoping to use this on my dashboard. Couldn't figure out what was doing wrong.

            Agreed. This is an annoying issue. Please fix this.

            Da Momma Boss added a comment - Agreed. This is an annoying issue. Please fix this.

            robyn added a comment - - edited

            +1 please fix. Balancing the team has become quite difficult.


            Also, if anyone has any work-arounds for displaying rolled-up workload by estimate, that would be cool.

            robyn added a comment - - edited +1 please fix. Balancing the team has become quite difficult.   Also, if anyone has any work-arounds for displaying rolled-up workload by estimate, that would be cool.

            ++ to that. I had to stop using Jira dashboards because of this, considering using another product because these are too unreliable 😢 

            Kyle Holzinger added a comment - ++ to that. I had to stop using Jira dashboards because of this, considering using another product because these are too unreliable 😢 

            Wale.Olojo added a comment -

            Please fix this.

            Wale.Olojo added a comment - Please fix this.

            Please fix this.

            Conor Foley added a comment - Please fix this.

            Impacting my team big time, currently can't track time spent on projects on any dashboards. Has this seriously been an issue for nearly two years without a fix?

            Jonathan Hunt added a comment - Impacting my team big time, currently can't track time spent on projects on any dashboards. Has this seriously been an issue for nearly two years without a fix?

            Yuriy Kuchynskyy added a comment - - edited

            +1 for the fix, no workaround yet, disappointed... here is my filter:

            assignee = currentUser() AND Sprint in openSprints() AND status in (Open, "In Progress", "In Review", Reopened, "To Do")

            agree with comment from ipulgar that problem exists only in case filter returns tickets with no time estimation and at the same time Time field to report on  is set to one of Current Estimate or Original Estimate


            @atalssian this one should be easy to fix

            Yuriy Kuchynskyy added a comment - - edited +1 for the fix, no workaround yet, disappointed... here is my filter: assignee = currentUser() AND Sprint in openSprints() AND status in (Open, "In Progress", "In Review", Reopened, "To Do") agree with comment from  ipulgar that problem exists only in case filter returns tickets with no time estimation and at the same time  Time field to report on   is set to one of Current Estimate or Original Estimate   @atalssian this one should be easy to fix

            Just encountered this issue today. Would be great to receive an update on upcoming fix. 

            Enrique Primelles added a comment - Just encountered this issue today. Would be great to receive an update on upcoming fix. 

            Arba added a comment -

            We still have the same issue. Any update when it going to be fixed, guys ?
            Thanks 

            Arba added a comment - We still have the same issue. Any update when it going to be fixed, guys ? Thanks 

            I have the same issue. When is this going to be fixed?

            Elad Franklin added a comment - I have the same issue. When is this going to be fixed?

            I had the same problem - mine was solved in the way of a mistake i made: I didn´t filled out estimated time, but story point estimate...so there was no data and therefore nothing that could have beed displayed.

            Marco Flachs added a comment - I had the same problem - mine was solved in the way of a mistake i made: I didn´t filled out estimated time, but story point estimate...so there was no data and therefore nothing that could have beed displayed.

            I seem to be encountering this with the normal pie chart.

            I have the same filter choice set up for another gadget (filter list) which is displaying perfectly. 

            This was fine on friday, only affecting me this morning.

            Rachel Welch added a comment - I seem to be encountering this with the normal pie chart. I have the same filter choice set up for another gadget (filter list) which is displaying perfectly.  This was fine on friday, only affecting me this morning.

            Anil Kumar added a comment -

            +1


            Anil Kumar added a comment - +1  

            Please check this, as it seems to be the only way to have a percentage based on velocity chart..

            Vasilis Gennaris added a comment - Please check this, as it seems to be the only way to have a percentage based on velocity chart..

            I started seeing this issue just this week. It seemed to work fine before that. I'm a new customer and don't have any real tickets in the system yet but will in the coming weeks. Sure wish this would be resolved soon.

            Shane Jorgenson added a comment - I started seeing this issue just this week. It seemed to work fine before that. I'm a new customer and don't have any real tickets in the system yet but will in the coming weeks. Sure wish this would be resolved soon.

            From my end, this error seems to be thrown when no issues with timespent/worklogs had been retrieved by the filter/project.

            Ignacio Pulgar added a comment - From my end, this error seems to be thrown when no issues with timespent/worklogs had been retrieved by the filter/project.

            Guy Cohen added a comment -

            When fixing this issue, please address JRACLOUD-67296 at the same time. JRACLOUD-67296 is directly affecting legibility of these charts.

            Guy Cohen added a comment - When fixing this issue, please address  JRACLOUD-67296  at the same time.  JRACLOUD-67296  is directly affecting legibility of these charts.

              jwalton joe
              enasef Eithar N. (Inactive)
              Affected customers:
              90 This affects my team
              Watchers:
              80 Start watching this issue

                Created:
                Updated:
                Resolved: