-
Type:
Bug
-
Resolution: Fixed
-
Priority:
 Medium
-
Component/s: Dashboard - Dashboards & Gadgets
-
42
-
Severity 2 - Major
-
7
Summary
Workload pie and Average Time in Status chart throwing "An internal server error occurred when requesting resource."
Steps to Reproduce
- Add "Workload pie chart gadget" or "Average time in status" to dashboard
- Select any filter -
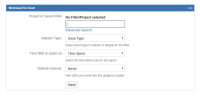
- Cannot Save

Expected Results
- Workload pie chart should appear
Actual Results

Update
This only happens when the Issues in the selected filter/project do not have a value for the Time to report field on (eg. time spent).
As soon as a value is added to the field, the error message goes away.


- relates to
-
-

- Closed
-
- mentioned in
-
Page Loading...