-
Type:
Suggestion
-
Resolution: Answered
-
Component/s: Dashboard - Dashboards & Gadgets
-
None
NOTE: This suggestion is for JIRA Cloud. Using JIRA Server? See the corresponding suggestion.
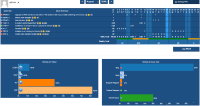
As a Product Owner/Product Manager, I would like to have reports/stats/gadgets for the total time spent per issue type, project, assignee for a given time period.
I'm particularly interested in the report/gadget by issue type.
ex. Gadget: new pie chart for time spent
Bugs - 35% of the time spent by all the team for project x
User Story - 40% of the time spent by all the team for project x
Improvement - 25% of the time spent by all the team for project x
option to choose between showing the total sum in hours or % is useful
- is related to
-
JRASERVER-35695 Reports/Stats/Gadgets for total time spent per issue type, project, assignee etc for a given period of time
- Closed
- relates to
-
JRACLOUD-961 Make more use of time tracking features
- Closed
-
JRACLOUD-7837 Time reports within a timeperiod
- Closed
-
JRACLOUD-23555 Workload Pie Chart
- Closed
-
JRACLOUD-26000 Request time spent report similar to workload report
- Closed
-
JSWCLOUD-5791 Visualising Time Spent/Needed on Milestone
- Closed
-
JSWCLOUD-7799 Sprint Report Time spent vs Story point
- Closed
-
JRACLOUD-1876 Developer time tracker report
- Gathering Interest
-
JRACLOUD-3286 Extends TimeTracking to comprehensive work+project reports for Projectmanagement
- Gathering Interest
