-
Type:
Bug
-
Resolution: Fixed
-
Priority:
High
-
Affects Version/s: 10.58
-
Component/s: multiple - ideation
-
None
-
1
-
Severity 3 - Minor
-
Breakers - SCORP3
-
None
Issue Summary
The ideation metric report calculations don't appear to accurately reflect what we have documented in the help topics, for example:
Total Percent Managed - % of all ideas in the Planned, Shelved, or Completed states.
Based on that, if a customer has 5 total issues in their Ideation backlog and two of those issues are in the Planned state, then the "Total Percent Managed" in the metrics report should show 40%. Instead it shows only 20% in the blue portion of the pie chart, as if only 1 of those Enhancement Requests is in one of the states described above.
In examining the code, it appears that Total Percent Managed is determined like so:
Complete2 = 100 - Int(percentageComplete)
				        call HChartIzone("Chart1", "Total Percent Managed", Complete2, "Ideas with Not Managed", percentageComplete , "Ideas with Managed", 250, 310)
...and percentageComplete is calculated with this formula:
percentageComplete = Round((newErs/totalErs) * 100,0)
...in other words, we are dividing the number of new Ideation tickets by the total number of tickets. There doesn't seem to be any calculation that takes Planned, Shelved, or Completed issues into account.
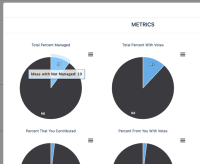
Also, on the metrics page, if we hover over the blue area of the pie chart that is supposed to represent "Ideas with Managed" it incorrectly shows "Ideas with Not Managed"
Steps to Reproduce
1) Navigate to the Ideation Portal on Jira Align.
2) Click "Manage Ideation Backlog" and make note of the requests in an New, Open, Planned, Completed state. See screenshot...in my example there are 51 total issues, with 46 in a new state, one in Open, and 4 in Planned.
3) Click the back button in the browser and Click "Key Metrics"
4) Observe the "Total Percent Managed" pie chart
Expected Results
- The total percent managed should include Open ideas
- Hovering over the blue portion of the pie Chart should read "Ideas with Managed" in the tooltip.
Actual Results
The total percent managed in the pie chart reads 10%, which is actually (46 new issues/51 total issues) * 100 = 90, then:
100 - 90 = 10%
Also hovering over the blue portion of the pie chart reads "Ideas with Not Managed" see screenshot.
Workaround
Currently there is no known workaround for this behavior. A workaround will be added here when available

