-
Type:
Bug
-
Resolution: Fixed
-
Priority:
Medium
-
Affects Version/s: 10.117.2
-
Component/s: Static Reports - General Reports
-
1
-
Severity 2 - Major
-
No
Issue Summary
This is reproducible on Data Center: (yes) | Also affects previous versions of on-premise
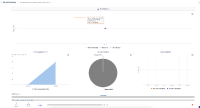
In the Sprint Coaching page, in the 'The Strategic' section we have a burndown chart that shows 'Task hours' and the range of time of the sprint, as per documentation
Sprint Coaching article
The Statistics: This section displays sprint statistics through four charts.
Burndown: The burndown line chart at the top of the section displays the hours remaining to burn, an ideal burn rate line, a capacity burndown, and a burn up
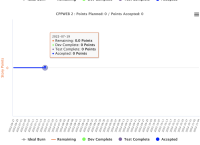
However, when there is no task assigned to the sprint and therefore no hours, the chart starts to display the dates as Dec 31, 1969, both in the pop-up and date range
Similar charts show the correct date range such as the Teams Burndowns when there's no task/hours for the sprint
Steps to Reproduce
Prerequisites
- PI must exist in the system, and be tied to a program.
- Teams must be created and tied to a program.
- Sprints must be created for each team and tied to a PI.
- Stories, with point values must be created.
- Stories must be assigned to sprints
1. Do not assign tasks and access the 'Sprint Coaching' report
2. Scroll down the 'The Strategics' section and notice that the chart displays the date Dec 31, 1969.
hovering over the chart is possible to notice the same date in the pop-up
Expected Results
Similar to other burndown/up charts, is expected to see the date range of sprint
Actual Results
The date Dec 31, 1969, is shown in both the chart line and the pop-up
for exemplification, below a similar chart in the 'Teams Burndown' report
Workaround
Currently there is no known workaround for this behavior. A workaround will be added here when available
- is connected to
-
JARDA-3090 Loading...
- resolves
-
PS-124235 Loading...

