-
Type:
Bug
-
Resolution: Fixed
-
Priority:
Medium
-
Affects Version/s: 10.74
-
Component/s: reports - work in process
-
None
-
Severity 3 - Minor
-
Rockets - TART4
-
None
Issue Summary
Raised by Peggy Graham, and confirmed by Kyle Foreman on ALIGNSP-4884
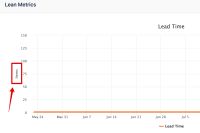
The Y-axis description in the graph Lean Metrics- Lead Time is named "items" instead of "time"
The help for this is correct, it says::
Lead Time: Line graph displaying the rolling history of the average time it takes work items in the PI to be accepted. A work item's lead time is calculated as the time that passes between the date it is created, and the date it is moved to an Accepted state, plus 1 day.
Example:
An epic is created on July 7th and marked as Accepted on July 9th.
July 7 - July 9 = 2 days +1 = 3 day Lead Time.
Since it's showing you a 3 day lead time, the graph should say Days, as Cycle Time does.
Steps to Reproduce
1. Go to Work in Process page
2. Click on Lean Metrics - upper right corner
3. Scroll down to the Lead Time graph
4. Look at Y-axis, it says Items. (screenshot attached)
Expected Results
Y-axis should be named "Days"
Actual Results
Y-axis is named generically "item".
Workaround
N/A
- is resolved by
-
ALIGNSP-4884 Loading...
