-
Type:
Bug
-
Resolution: Fixed
-
Priority:
High
-
Affects Version/s: None
-
Component/s: reports - portfolio program predictability report
-
None
-
4
-
Severity 2 - Major
-
A-Team - SCORP 5
-
None
KB Note:
Planned and Delivered value should be the roll-up of team objectives excluding stretch (not an average).
Issue Summary
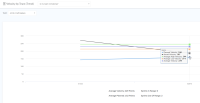
This report seems to have changed at some point and is no longer following the SAFe methodology.
The Program Predictability Report should render the following:
X-axis: Selected Program Increments in chronological order by end date
Y-axis: Percentage Achieved (bottom boundary as 0, a top boundary as 10% than the highest value)
Each point is the total achieved for a given team. In the example below, for Q1 2020, Incredibles would show a total achieved of 102.86%
The area between 80% and 100% should be highlighted
The all teams line should render as a sum total for all teams
Example of the working report:
Steps to Reproduce
- Step 1 - Run current Program Predictability Report
- Step 2 - See results
Expected Results
X-axis: Selected Program Increments in chronological order by end date
Y-axis: Percentage Achieved (bottom boundary as 0, top boundary as 10% than the highest value)
Each point is the total achieved for a given team. In the example below, for Q1 2020, Incredibles would show a total achieved of 102.86%
The area between 80% and 100% should be highlighted
The program line should render as a total for all teams
Actual Results
This report isn't showing PIs, it isn't showing the teams correctly, and it's not following the correct logic noted above in the expected results
Workaround
No. current workaround for this.
- resolves
-
ALIGNSP-315 Loading...
-
ALIGNSP-2336 Loading...
-
ALIGNSP-2391 Loading...


