-
Type:
Bug
-
Resolution: Fixed
-
Priority:
Medium
-
Component/s: Connect - Jira
-
None
-
Severity 3 - Minor
-
M
Issue Summary
On a dashboard with several items, only one dashboard item loads correctly when the dashboard's "Refresh" button is pressed.
This applies to all dashboard items that call the Connect Javascript API. If there are multiple dashboard items on the page, only one will load correctly. This bug occurs only when clicking the "Refresh" button on the top right menu. Refreshing via browser and manually clicking the refresh button on each dashboard item works correctly.
This issue has been reported by customers using the Custom Charts app, though the bug is not exclusive to this app and occurs with all dashboard items.
Steps to Reproduce
- Create a Connect app with a Jira dashboard item module.
- Set the dashboard item module's "refreshable" property to "true"
- In the dashboard item iframe, make a call to any of the Connect JavaScript APIs
- Install the app on a site. In a Jira dashboard, add 2 or more of your app's dashboard items.
- Load the dashboard, all iframes will load correctly.
- Click the "Refresh" button in the top right corner
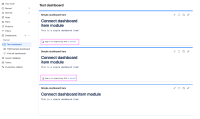
- One iframe will load correctly. For all others you will see the "App is not responding" message
Expected Results
The iframes should load and execute successfully. The call to the Connect Javascript APIs should not timeout.
Actual Results
Only one dashboard item will load. All dashboard items will fail to load and you will see an "App is not responding" message

Workaround
Clicking the refresh button on the dashboard item directly will load the iframe correctly.
