-
Type:
Suggestion
-
Resolution: Answered
-
None
-
Component/s: AgileBoard
I find that one of the most useful tools for our software development team is the Version Report chart. Since the addition of this one chart, we're able to much more accurately forecast the completion of a release and extremely accurately communicate the effect of scope creep on our completion date. We have been able to determine when it's necessary to add resources to a project and communicate to upper management exactly why they need to make a priority decision on all open projects due to release schedules.
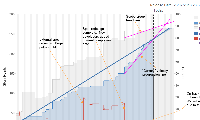
However, in order to do this, we currently create our own trend lines with a sheet of paper held up to the monitor or projector. I've attached a screenshot that explains why this is necessary.
First off, being able to annotate this graph as I've done in this screenshot would prove invaluable for project status reports as well as "lessons learned" post-project analysis. I'm thinking GreenHopper stores as many points on the graph as is requested as well as an annotation for each. These points are stored per version tracked in GreenHopper.
I feel like the "project start" date should show the entire progression (graph) of a project. However, there needs to be an option for a progression line start date separate from the project start date, as the June re-specification and reallocation of developers to the project requires a new velocity trend line. I already did this in March, and have been considering doing it again, but if I do this, the new graph loses the historical nature as annotated in the screenshot.
Another cool idea is a "scope creep trend line". I just noticed today that even back all the way until early mid-april, our scope creep has been extremely linear. This, combined with current (recent) velocity could possibly create a "true" completion date where the two lines I drew intersect?
One thing I didn't show on the graph was the ability to speculate on an increased velocity over your current velocity. This could have been used after the spec redesign in late June and the addition of more developers to the project. I'm thinking a box on the right that says "Speculate an additional X story points per week". This would cause the velocity trend line slope to increase starting today, causing an upward kink in the velocity trend line with an adjusted final completion date.
I know this is a huge request, but I feel like this adds a significant amount of benefit to an already great feature. These new features will hugely help us when communicating outside our group and committing to release dates.
- is related to
-
JSWSERVER-1829 Working with Velocity in JIRA Software
- Closed
