• Icon: Suggestion Suggestion
    • Resolution: Duplicate
    • None
    • None
    • None
    • JDOG
    • We collect Jira feedback from various sources, and we evaluate what we've collected when planning our product roadmap. To understand how this piece of feedback will be reviewed, see our Implementation of New Features Policy.

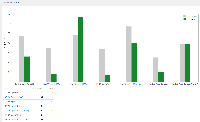
      On the Agile Report board for Kickass - there are 16 Sprints... however only the last 7 sprints are shown in the Velocity Chart.

          Form Name

            [JSWSERVER-6242] Velocity Chart only shows the last 7 sprints

            Hanna added a comment -

            Hi everyone,

            Thank you so much for your votes and comments on this suggestion. We have a few open questions around the design of this feature and would love to hear your feedback on it. We have created a survey to capture the feedback: https://surveys.atlassian.com/jfe/form/SV_8AhloEb2g2MalkF
            Thank you again for all your continuous feedback!


            Kind regards,
            Hanna Sazonava
            UX Designer, Jira Server

            Hanna added a comment - Hi everyone,
 Thank you so much for your votes and comments on this suggestion. We have a few open questions around the design of this feature and would love to hear your feedback on it. We have created a survey to capture the feedback:  https://surveys.atlassian.com/jfe/form/SV_8AhloEb2g2MalkF Thank you again for all your continuous feedback!
 Kind regards, Hanna Sazonava UX Designer, Jira Server

            same, just last 7

            Mohamed Elhachmi added a comment - same, just last 7

            Michèle added a comment -

            I see that this issue is resolved but I don't manage to see more than the 7 last sprints in the velocity chart. What did I miss? How can I view all the previous sprints in the velocity chart page report?

            Michèle added a comment - I see that this issue is resolved but I don't manage to see more than the 7 last sprints in the velocity chart. What did I miss? How can I view all the previous sprints in the velocity chart page report?

            Can't believe there is an issue for this basic thing

            Cristian Lopez added a comment - Can't believe there is an issue for this basic thing

            I would like this to be configurable as well, would love a start / end date range picker for this report, otherwise we will have to resort to plugins or third party services.  This type of reporting should be baked in.

            Brandon Burkett added a comment - I would like this to be configurable as well, would love a start / end date range picker for this report, otherwise we will have to resort to plugins or third party services.  This type of reporting should be baked in.

            It's better to show Total planned stories,Actual delivered,incomplete,added after start stories in sprint.

            ashish kanaparthi added a comment - It's better to show Total planned stories,Actual delivered,incomplete,added after start stories in sprint.

            I just used the "project = EXAMPLE and sprint in ( 'sprint 1', 'sprint 2', 'sprint 3' ) " to get the old data but i could not see the old sprints in the velocity chart, its still showing the same last 7 sprint, can anyone help in this.?

            Sridhar Radhakrishnan added a comment - I just used the "project = EXAMPLE and sprint in ( 'sprint 1', 'sprint 2', 'sprint 3' ) " to get the old data but i could not see the old sprints in the velocity chart, its still showing the same last 7 sprint, can anyone help in this.?

            Problem:
            Velocity api resource GET /rest/greenhopper/1.0/rapid/charts/velocity?rapidViewId=123 has response with 7 Sprints only.
            It's essential to be able get information about velocity for all sprints that is present in the system.

            Required to:

            • Create custom report that is based on sprint velocity data
            • Calculate average velocity and predictability

            All above is necessary to see a whole picture: where was we and where are we now?

            Expected behavior:
            Pagination should be added to API: maxResults, startAt with default value maxResults = 7 and startAt = 0 to keep backward compatibility.

            Implementation will solve:

            • Sprint limitation on a Velocity Chart (chart is based on api)
            • Build own chart with velocity data
            • Api parameters inconsistency

            Thank you for your help.

            Sergii Pryz added a comment - Problem : Velocity api resource GET /rest/greenhopper/1.0/rapid/charts/velocity?rapidViewId=123 has response with 7 Sprints only. It's essential to be able get information about velocity for all sprints that is present in the system. Required to : Create custom report that is based on sprint velocity data Calculate average velocity and predictability All above is necessary to see a whole picture: where was we and where are we now? Expected behavior : Pagination should be added to API: maxResults, startAt with default value maxResults = 7 and startAt = 0 to keep backward compatibility. Implementation will solve: Sprint limitation on a Velocity Chart (chart is based on api) Build own chart with velocity data Api parameters inconsistency Thank you for your help.

            -

            Deleted Account (Inactive) added a comment - - edited -

            adam-roth added a comment -

            This should be a configurable option/filter built in to Greenhopper. There are more use-cases for the chart than just 'calculating velocity', and moreover the duration of a sprint isn't something that's fixed; it goes according to a team's (or company's) preference. If a team is running weekly sprints, you might want 10-12 datapoints to use when calculating a velocity. And if they're running monthly sprints, 7 is probably far too many.

            At the end of the day, it's just plain inappropriate (and a clear violation of zero-one-infinity) for Jira/Greenhopper/Jira Agile to be saying "7 datapoints is the correct number, so that's all you get". Jira/Greenhopper/Jira Agile is a tool. It needs to do what its operators tell it; not the other way around.

            adam-roth added a comment - This should be a configurable option/filter built in to Greenhopper. There are more use-cases for the chart than just 'calculating velocity', and moreover the duration of a sprint isn't something that's fixed; it goes according to a team's (or company's) preference. If a team is running weekly sprints, you might want 10-12 datapoints to use when calculating a velocity. And if they're running monthly sprints, 7 is probably far too many. At the end of the day, it's just plain inappropriate (and a clear violation of zero-one-infinity) for Jira/Greenhopper/Jira Agile to be saying "7 datapoints is the correct number, so that's all you get". Jira/Greenhopper/Jira Agile is a tool. It needs to do what its operators tell it; not the other way around.

              Unassigned Unassigned
              shoughton Simone Houghton
              Votes:
              49 Vote for this issue
              Watchers:
              46 Start watching this issue

                Created:
                Updated:
                Resolved: