-
Type:
Suggestion
-
Resolution: Fixed
-
Component/s: None
-
Environment:Standalone Jira 4.1
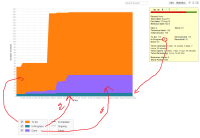
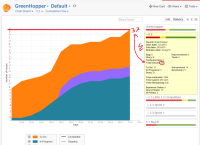
The Cumulative Flow Diagram introduced in Greenhopper 5.2 does not represent the actual state of the Version it is displaying. And it is displaying the Order wrong.
As visible in the attached image the In" Progress" shows somewhere around 5 Issues but the in progress issues are actually 0 so the diagram should reflect this. Also the order of the Diagram segments should always reflect the Task board order. So the Diagram should be Orange, Turquoise, Purple not Orange Purple, Turquoise.
One thing I also noticed is that when I change the Task board order the Diagram does not update correctly. Sometime only three Slots are displayed in the Legend even though the Task board has 4 columns, and the order of the graphs is also wrong.
As nice as a CFD is in the current state it is not as useful as it could and maybe should be.
- is related to
-
JSWSERVER-2375 Feedback on implementation of cumulative flow chart
- Closed
-
JSWSERVER-2409 CFD category order should match column order on Task Bord
- Closed
- relates to
-
JSWSERVER-2456 Cumulative Flow Diagram CFD Legend does not display all Graphs
-
- Closed
-
-
JSWSERVER-2457 Cumulative Flow Diagram does not update graphs correctly when manipulated through Legend
-
- Closed
-

