-
Type:
Suggestion
-
Resolution: Fixed
-
Component/s: None
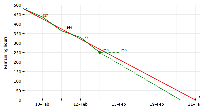
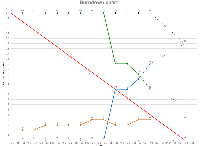
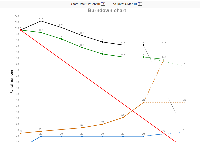
Currently the trendline in a burndown chart is based on the (first and) latest data-point of the series. However, usually this data-point represents a time in the future (end of day today). Thus it makes more sense to base the trendline on the previous day (the second-latest data-point in the series).
- is duplicated by
-
JSWSERVER-1986 Burndown-Chart shows one more day
-
- Closed
-
-
JSWSERVER-1987 Option to display burndown chart as of end of previous day
- Closed


