-
Type:
Suggestion
-
Resolution: Tracked Elsewhere
-
None
-
Component/s: None
-
None
Following from issues GHS-4136 and GHS-4139, I would like to request a variant of the same thing, which hopefully won't be rejected as well ![]()
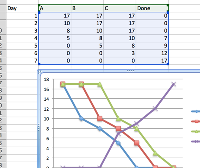
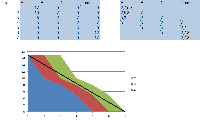
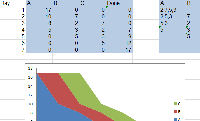
We would also like to support the burndown of story points but without either linking to real time or editing the story point field. A solution that would be suitable for us, and hopefully for others, would be to offer a burndown chart, which shows under the existing curve a stacked area coloured according to the states of the non-completed issues. One would just have to be able to define a colour for each state in the board configuration and then Jira agile could do the rest. Essentially this amounts to a fusion of a cumulative flow diagram with a burndown chart as shown here using the example created by Steve Lane (three states, A, B and C, and 4 issues with 2, 7, 5 and 3 story points respectfully, progressing through the states from A to Done):

Original request was:
Following from issues GHS-4136 and GHS-4139, I would like to request a variant of the same thing, which hopefully won't be rejected as well :-)
We would also like to support the burndown of story points but without either linking to real time or editing the story point field. A solution that would be suitable for us, and hopefully sufficiently flexible for others, would be to define partial burndown percentages for the intermediate columns. E.g. one could define an intermediate state/column "development complete - in testing" and associate the column with 70% burndown (with "complete" in the final column for the usual 100%). This wouldn't be 100% correct but at least more accurate and reflect some progress. If one could define the burndown % for any intermediate column in such a way in the board configuration then users could define as many partial burndown states as they wish for the granularity they seek. Clearly the result is that the burndown chart (and respective reports) would apply the respective partial burndown of the issues' SP as they progress through the different intermediate states.
- is cloned from
-
JSWSERVER-4136 Story point burn down
- Closed
- is duplicated by
-
JSWSERVER-4139 As an agile user, I would like to burn down story points similar to how I burn down hours - on a daily basis
- Closed
- is related to
-
JSWSERVER-2785 As a GH user I would like to be able to view the cumulative flow diagram using story points
- Gathering Interest
-
JSWSERVER-5153 Make CFD in RB Sprint sensitive
- Gathering Interest


