Uploaded image for project: 'Jira Software Data Center'
  1. Jira Software Data Center
  2. JSWSERVER-10359

Show calculated cycle time, lead time, WIP when hovering over Cumulative Flow Diagram in Kanban Reports

    • 0
    • We collect Jira feedback from various sources, and we evaluate what we've collected when planning our product roadmap. To understand how this piece of feedback will be reviewed, see our Implementation of New Features Policy.

      It is very difficult to gather information from the Cumulative Flow Diagram. When hovering over the diagram it would be extremely helpful to see the calculated cycle time, lead time, and WIP. See the attached image for how these can be calculated.
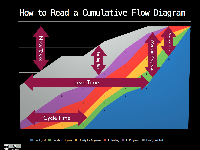
        1. cfd.jpg
          cfd.jpg
          320 kB

            [JSWSERVER-10359] Show calculated cycle time, lead time, WIP when hovering over Cumulative Flow Diagram in Kanban Reports

              Unassigned Unassigned
              107759dec6b1 Michael DeCourcey
              Votes:
              31 Vote for this issue
              Watchers:
              19 Start watching this issue

                Created:
                Updated: