-
Type:
Bug
-
Resolution: Timed out
-
Priority:
Low
-
Component/s: None
-
Severity 3 - Minor
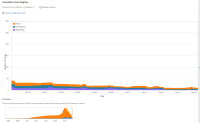
In the Agile reports, the Cumulative Flow Diagram seems to be scaled based on the highest value in the Overview instead of the highest value in the selected range. See attached image.
Given our project flow (of this one project), the diagram is not usable anymore.
It would be nice if the diagram was scaled properly for the selected range.
- is related to
-
JSWCLOUD-12298 Y axis of Cumulative Flow Diagram report should scale automatically
- Closed
