-
Type:
Bug
-
Resolution: Unresolved
-
Priority:
Low
-
None
-
Affects Version/s: 8.20.16
-
Component/s: System Administration - Integrity Checker
-
8.2
-
9
-
Severity 3 - Minor
-
1
Issue Summary
This is reproducible on Data Center: yes
Steps to Reproduce
- Setup a Jira SW or SM instance with 4GB of Heap
- Create 140 Issues with 30,000,000 characters in each of their Description fields
- Run the Integrity Checker through Jira's UI
Expected Results
The Integrity Checker would finish and report no issues to be fixed.
Actual Results
Jira will run into an OutOfMemoryError or enter consecutive Full GC cycles.
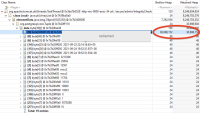
If a Heap dump's generated, we'll see the Integrity Checker HTTP thread retaining the most Heap:

Example of a ~10GB Heap instance with over 75% retained by the Integrity Checker Thread alone.

Example of how a single issue with 30 million characters in the Description can retain so much memory.
Workaround
You may try running some equivalent queries directly on the DB to bypass loading data into the application:
SQL equivalents for Jira server's workflow integrity checks
- relates to
-
JRASERVER-65265 IntegrityChecker may cause intensive JVM memory pressure and FullGC
-
- Closed
-

