Uploaded image for project: 'Jira Data Center'
  1. Jira Data Center
  2. JRASERVER-74626

High Memory Utilisation with Async Webhooks

    XMLWordPrintable

Details

    • Bug
    • Resolution: Fixed
    • Medium
    • 9.7.0
    • 8.20.12
    • Webhooks
    • None
    • 8.2
    • 2
    • Severity 2 - Major
    • 7
    • Hide
      Atlassian Update – 23 February 2023

      Hi everyone,

      I'm happy to announce that fix for this issue will be release in the upcoming Jira 9.7.0. According to our policy, after proper soaking time this fix will be backported to Jira LTS versions: 9.4 and 8.20. You can expect it to happen in Q2 2023.

      Fix will allow Jira to properly manage memory in areas related to asynchronous webhooks so that they do not cause memory leaks anymore

      Thank you,
      Michał Błajet
      Jira Developer

      Show
      Atlassian Update – 23 February 2023 Hi everyone, I'm happy to announce that fix for this issue will be release in the upcoming Jira 9.7.0. According to our policy, after proper soaking time this fix will be backported to Jira LTS versions: 9.4 and 8.20. You can expect it to happen in Q2 2023. Fix will allow Jira to properly manage memory in areas related to asynchronous webhooks so that they do not cause memory leaks anymore Thank you, Michał Błajet Jira Developer

    Description

      Issue Summary

      Customer is observing high memory utilisation over time. They have been using Jira with max heap of 30 GB with async webhooks and in two or three weeks it is observed that memory utilisation goes to 90% and higher. It leads to back to back Full GC which even are not able to release memory. This overall make Jira unresponsive.

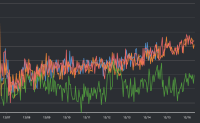
      Probably this is due slow webhook endpoints. Customer reports that heap utilisation increases over time. These screenshots are captured from heap-dump when captured in regular intervals(in every 4 day). This is because at time when heap utilisation was more than 90%, we were not able to capture heap-dump and even thread-dump.


      Steps to Reproduce

      Unfortunately this is not reproducible in test lab or staging environment.
      This is reproducible on Data Center: (no)

      Expected Results

      Heap Utilisation should not be so high that it leads to back to back Full GCs. There should be a configuration to set webhook http async connection SocketTimeout to smaller value so that slow connections can be released. This would garbage collect objects.

      Actual Results

      High Heap Utilisation.

      Workaround

      There is no workaround as of now.

      Attachments

        Issue Links

          Activity

            People

              cb173a7ca7c0 Michał Błajet
              ad506bb12b8e Chandra Shekhar Pandey
              Votes:
              3 Vote for this issue
              Watchers:
              10 Start watching this issue

              Dates

                Created:
                Updated:
                Resolved: