-
Type:
Suggestion
-
Resolution: Unresolved
-
None
-
Component/s: Dashboard & Gadgets
-
None
-
1
Issue Summary
This is reproducible on Data Center: yes
Steps to Reproduce
1. Create a new Dashboard. We can name it as "Test Dasboard".
2. Add a new gadget.
3. Search for Heat Map Gadget. Click on "Add gadget" button.
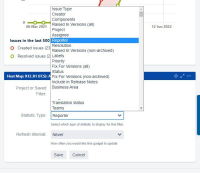
4. Select "Statistic Type", here we find that dropdown list is unsorted. Thus if there are lot of field then it would be difficult to search for specific statistic. 
Expected Results
Results in "Statistic Type" list should be sorted in alphabetical order.
Actual Results
Results in "Statistic Type" list is unsorted.
If we compare Pie-chart gadget, then Statistics are sorted. This code(which I find for Pie-chart) snippet is not written for HeatMap gadget.
File:  ./jira-project/jira-components/jira-plugins/jira-gadgets-plugin/src/main/resources/gadgets/piechart-gadget.xml
        if (gadgets.views.getCurrentView().getName() === "canvas") {
                                var dataTable = AJS.gadgets.templater.Table ({
                                    descriptor: function (args) {
                                        return {
                                            cols: [
                                                {header: args.statType, preSorted: true},
                                                {header: gadget.getMsg("gadget.piechart.issues"), sort: "asc"},
                                                {header: "%"}
                                            ],
                                            data: function () {
                                                var rows = [];
                                                if (args.chartData) {
                                                    AJS.$(args.chartData).each(function (i) {
                                                        rows.push([
                                                            {value: i, label: gadgets.util.escape(this.key)},
                                                            {value: gadgets.util.escape(this.value), label: "<a href='" + this.url + "'>" + gadgets.util.escape(this.value) + "</a>"},
                                                            {value: this.pecentage, label: this.pecentage}
                                                        ]);
                                                    });
                                                }
                                                return rows;
                                            }()
                                        };
                                    },
                                    sortable: true,
                                    args: [{key: "chartData", data: args.chart.data}, {key: "statType", data: args.chart.statType}]
                                });
Workaround
None.