-
Type:
Bug
-
Resolution: Fixed
-
Priority:
Low
-
None
-
Affects Version/s: 8.13.0, 8.16.0, 8.19.0
-
Component/s: Documentation - All
-
None
-
8.13
-
1
-
Severity 3 - Minor
Issue summary
The information provided in the Cluster information in the audit log section of the documentation Jira cluster monitoring is incorrect and incomplete:
- Issue 1:
- Problem: the page Jira administration > System > Advanced audit log mentioned in the 1st step is incorrect (this page does not exist)
- Solution: the correct page should be Jira administration > System > Audit log
- Issue 2:
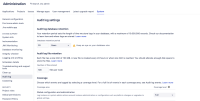
- Problem: we mention the following instruction: "The events are logged when you select the Full level of the Global configuration and administration coverage area.". However, this instruction is unclear and incomplete, and does not tell us where to go and which setting to change
- Solution: we need to explain that we need to go first to the page Jira administration > System > Audit log > ... > Settings and then set the Global configuration and administration coverage area to Full
- Issue 3:
- Problem: the section View runtime and system info located under the section Cluster information in the audit log does not have a header font. As a result, it looks like this section is also part of the audit log section, while it has nothing to do with it
- Solution: add the proper header to the section View runtime and system info, so that it can be displayed as a proper section
Also, adding a few screenshots would be helpful, so that the customer can see specific examples of what is displayed in the audit logs.
Suggestion
For Issue 1 and Issue 2:
Change the whole Cluster information in the audit log section as shown below:
To help you manage your cluster, you can also find the information on nodes leaving or joining the cluster in your Audit log.
To be able to record these events in the Audit logs, follow the steps below:
- Go to Jira administration > System > Audit log > ... > Settings, set the Global configuration and administration coverage area to Full, and click on the Save button

- Go to Jira administration > System > Audit log, and search for the "clustering" keyword to see the logged cluster-related events

We log the following events:
- NodeJoined - a new node has joined the cluster
- NodeReJoined - an existing node was restarted and re-joined the cluster
- NodeLeft - a node received the OFFLINE status
- NodeRemoved - a node was removed from the cluster
- NodeUpdated - all other cases when existing node was updated
For Issue 3:
Add the proper header to the section View runtime and system info, so that it can be displayed as a proper section