-
Type:
Bug
-
Resolution: Obsolete
-
Priority:
High
-
None
-
Affects Version/s: 7.2.15, 7.6.15, 7.13.13
-
Component/s: Indexing
-
7.02
-
10
-
Severity 2 - Major
-
66
![]() This is not a Jira core bug, ticket created to track the problem and for transparency.
This is not a Jira core bug, ticket created to track the problem and for transparency.
The problem is a combination of different factors, Java platform and libraries limitations that currently exist.
Issue Summary
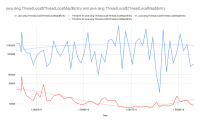
Under a very high load and a large number of Lucene operations on a large Lucene index, JVM starts having contention in reading java.lang.ThreadLocal variables.
To be specific java.lang.ThreadLocal$ThreadLocalMap.getEntry and java.lang.ThreadLocal$ThreadLocalMap.getEntryAfterMiss calls become very contended which leads to high CPU usage (and high LA).
In short, it’s a combination of 3 factors:
- High allocation rate of ThreadLocal - caused by Lucene lib (it's tracking index segments in org.apache.lucene.util.CloseableThreadLocal)
- and as consequence very high number of java.lang.ThreadLocal$ThreadLocalMap$Entry in the corresponding java.lang.ThreadLocal$ThreadLocalMap
- Slow GC collection of ThreadLocal since they are weakly referenced - a "feature" of modern GC (see JDK-8182982)
- High pressure on ThreadLocal by doing high concurency reads from cache
- Jira uses EhCache, which uses ReentrantReadWriteLock internally, which uses ThreadLocal
Steps to Reproduce
- Large Jira instance with large Lucene (to have many segments)
- Apply high load:
- a lot of Lucene operations
- large number of cache reads (eg. CachingProjectRoleAndActorStore.getProjectRole)
Expected Results
- Application is stable under load
Actual Results
- Application is not stable, large CPU usage
- Growing number of java.lang.ThreadLocal and corresponding java.lang.ThreadLocal$ThreadLocalMap$Entry
Notes about the symptoms
- Example of the stack-trace collected during the peak time:
"http-nio-8080-exec-9" #209 daemon prio=5 os_prio=0 cpu=15490900.00 tid=0x00007f470434c800 nid=0x58f2 / 22770  pthread-id=139914765780736 runnable     java.lang.Thread.State: RUNNABLE
	at java.lang.ThreadLocal$ThreadLocalMap.getEntryAfterMiss(Ljava/lang/ThreadLocal;ILjava/lang/ThreadLocal$ThreadLocalMap$Entry;)Ljava/lang/ThreadLocal$ThreadLocalMap$Entry;(ThreadLocal.java:480)
	at java.lang.ThreadLocal$ThreadLocalMap.getEntry(Ljava/lang/ThreadLocal;)Ljava/lang/ThreadLocal$ThreadLocalMap$Entry;(ThreadLocal.java:455)
	at java.lang.ThreadLocal$ThreadLocalMap.access$000(Ljava/lang/ThreadLocal$ThreadLocalMap;Ljava/lang/ThreadLocal;)Ljava/lang/ThreadLocal$ThreadLocalMap$Entry;(ThreadLocal.java:327)
	at java.lang.ThreadLocal.get()Ljava/lang/Object;(ThreadLocal.java:163)
	at java.util.concurrent.locks.ReentrantReadWriteLock$Sync.tryAcquireShared(I)I(ReentrantReadWriteLock.java:514)
	at java.util.concurrent.locks.AbstractQueuedSynchronizer.acquireShared(I)V(AbstractQueuedSynchronizer.java:1282)
	at java.util.concurrent.locks.ReentrantReadWriteLock$ReadLock.lock()V(ReentrantReadWriteLock.java:760)
	at net.sf.ehcache.concurrent.ReadWriteLockSync.lock(Lnet/sf/ehcache/concurrent/LockType;)V(ReadWriteLockSync.java:50)
	at net.sf.ehcache.constructs.blocking.BlockingCache.acquiredLockForKey(Ljava/lang/Object;Lnet/sf/ehcache/concurrent/Sync;Lnet/sf/ehcache/concurrent/LockType;)V(BlockingCache.java:196)
	at net.sf.ehcache.constructs.blocking.BlockingCache.get(Ljava/lang/Object;)Lnet/sf/ehcache/Element;(BlockingCache.java:158)
	at com.atlassian.cache.ehcache.LoadingCache.get(Ljava/lang/Object;)Lnet/sf/ehcache/Element;(LoadingCache.java:79)
	at com.atlassian.cache.ehcache.DelegatingCache.get(Ljava/lang/Object;)Ljava/lang/Object;(DelegatingCache.java:108)
	at com.atlassian.jira.cache.DeferredReplicationCache.get(Ljava/lang/Object;)Ljava/lang/Object;(DeferredReplicationCache.java:48)
	at com.atlassian.jira.permission.DefaultPermissionSchemeManager.getPermissionSchemeEntries(JLcom/atlassian/jira/security/plugin/ProjectPermissionKey;)Ljava/util/Collection;(DefaultPermissionSchemeManager.java:293)
...
- Count of stack in the thread-dumps:
grep -c 'java.lang.ThreadLocal$ThreadLocalMap.getEntryAfterMiss'  jira_threads.*
jira_threads.2020-04-23_13-49-49.txt:26
jira_threads.2020-04-23_13-49-57.txt:3
jira_threads.2020-04-23_13-50-04.txt:24
jira_threads.2020-04-23_13-50-11.txt:18
jira_threads.2020-04-23_13-50-18.txt:23
jira_threads.2020-04-23_13-50-25.txt:25
jira_threads.2020-04-23_13-50-33.txt:25
jira_threads.2020-04-23_13-50-40.txt:25
jira_threads.2020-04-23_13-50-47.txt:20
jira_threads.2020-04-23_13-50-54.txt:26
jira_threads.2020-04-23_13-51-01.txt:32
jira_threads.2020-04-23_13-51-09.txt:27
- memory allocation
Class Number of objects Size java.lang.ThreadLocal$ThreadLocalMap$Entry 880,393 49,302,008 java.lang.ThreadLocal$ThreadLocalMap$Entry[] 710 13,328,016 java.lang.ThreadLocal 51,109 1,226,616
Other notes
Reference to similar problems:
- with Elastic Search - https://discuss.elastic.co/t/indexing-performance-degrading-over-time/40229/38
- OpenDJ - https://bugster.forgerock.org/jira/browse/OPENDJ-4027
- http://cs.oswego.edu/pipermail/concurrency-interest/2018-October/016685.html
When short-lived ThreadLocals are created and die at a rate linear to application throughout, this leads to ThreadLocal maps inactive threads holding thousands or millions of entries, to extremely long collision chains, and to situations where half the CPU is spent walking those chains in ThreadLocal.get().
- https://bugs.openjdk.java.net/browse/JDK-6625724
Note on ThreadLocal:
- ThreadLocal variables use WeakReferences as internal implementation, which are subject to different cleanup rules than normal references.
- On G1GC, we have a time budget for maximum GC pause (a soft goal), and JVM may opt to delay the collection of WeakReferences to a cleanup of tenured space to meet that goal (it will only clean up a subset of cleanable weak references in young GC). This may cause a build-up of entries in the ThreadLocalMaps of threads.
- the following JVM parameter will give more details in GC logs about how much WeakReferences are cleaned up:
- -XX:+PrintReferenceGC
Workaround
A couple of options are available here:
- upgrading to Jira 8.x
- due to changes in Lucene and Jira it produces less ThreadLocal
- tuning G1GC
- give it less aggressive goal to allow more WeakReferences to be collected
- switching to CMS
- based on Elastic Search examples, resolve the problem as it collects Weakeferences more aggressively
- It's an old GC algorithm, may have more frequent peaks and longer average collection time
- is related to
-
JRASERVER-66356 JIRA becomes unresponsive because of growing recency queue in frequently used projectRoleActors cache.
-
- Closed
-
-
JRASERVER-68564 Copying of SearchRequest performs user search
-
- Closed
-
-
JRASERVER-68567 DefaultShareManager.isSharedWith performs user search 2x times
-
- Closed
-
- relates to
-
JRASERVER-71160 DeferredReplicationCachedReference 'get' operation triggers unnecessary replication events
- Closed
- mentioned in
-
Page Loading...
-
Page Loading...
-
Page Loading...
-
Page Loading...
-
Page Loading...
-
Page Loading...
-
Page Loading...
-
Page Loading...

