-
Type:
Bug
-
Resolution: Unresolved
-
Priority:
Low
-
None
-
Affects Version/s: 7.6.3, 7.7.2, 8.20.7, 9.4.5, 9.4.7
-
Component/s: System Administration - Configuration Tool
-
7.06
-
15
-
Severity 3 - Minor
-
0
Summary
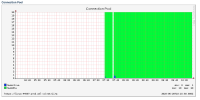
According to the document Monitoring database connection usage, the y-axis in Connection Pool graph is supposed to equal to pool-max-size but it isn't.
The scale of the vertical axis is equal to the maximum number of connections
Environment
 Jira 7.0.10 renders as expected
 Jira 7.6.3 doesn't
Steps to Reproduce
- Increase pool-max-size to 100 in dbconfig.xml
- Access to the database monitoring page (path: /secure/admin/monitor_database.jspa)
Expected Results
The y-axis takes account of the value of pool-max-size.
Actual Results
The y-axis does not take account of the value of pool-max-size.
i.e: PostgreSQL DB(20)

i.e. Oracle DB (22):

Workarounds
Workaround 1
- Create support zip and refer "application-config/dbconfig.xml" to see the actual max pool size.
Workaround2
- Refer to our document Monitor application performance to configure advanced monitoring via JMX.
- is related to
-
JRASERVER-30798 Connection Pool graph y axis values are not properly displayed when we set a high database pool value
-
- Closed
-