-
Type:
Bug
-
Resolution: Fixed
-
Priority:
Medium
-
Affects Version/s: 3.13.5, 4.1.1, 5.0, 5.2.5, 6.0.8
-
Component/s: None
-
3.13
Summary
When a session contains a search result (as a result of using any search in JIRA), there is a possibility that during standard view issue operations a bottleneck can occur on the NextPreviousPager monitor. This can result in the entire JIRA becoming unresponsive and rendering the instance unusable.
Steps to Reproduce
It is not currently known what the exact steps are to reproduce this, however it involves viewing issues when a search result is contained within a user session.
Expected Results
JIRA operates as normal.
Actual Results
JIRA becomes unresponsive as lock congestion occurs on the NextPreviousPager monitor.
Notes
View issue screen is pretty fast (my measures points to 16 RPS), but only we have no active search. If the session contain a search request, updating NextPreviousPager is a significant bottleneck.
Even on 1 RPS response time raise exponentially and after 1 minute of load JIRA became unresponsive.
The performance impact can be exacerbated by using complicated searches or expensive JQL functions.
Diagnosis
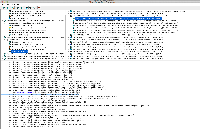
Generate a Thread Dump 6 times every 10 seconds during periods of unresponsiveness and read it with TDA or a similar tool. If there is a bottleneck in the NextPreviousPager monitor as per the attached screenshot there is a significant likelihood the instance is affected by this problem.
This can also be identified with the below commands - we're going to grep the thread dumps to see how many threads that are waiting to lock NextPreviousPager. If there's a high number persisting across multiple thread dumps over time, it's probably this bug.
$ grep "waiting to lock.*NextPreviousPager" jstack.4440.threadHigh.* | awk '{print $1}' |sort |uniq -c
 24 jstack.4440.threadHigh.103649.939600529:
 27 jstack.4440.threadHigh.103701.620551473:
 25 jstack.4440.threadHigh.103713.178859435:
 25 jstack.4440.threadHigh.103724.736087099:
 25 jstack.4440.threadHigh.103736.376659166:
This shows the number of threads waiting to lock the monitor grouped by thread dump. In each thread dump that's 25+ which is a large number. Or read the threadies and check for larger numbers of this:
"http-bio-8080-exec-1479" daemon prio=10 tid=0x00007f3fe07ba800 nid=0x6d4f waiting for monitor entry [0x00007f3e7c581000]
 java.lang.Thread.State: BLOCKED (on object monitor)
 at com.atlassian.jira.issue.pager.NextPreviousPager.update(NextPreviousPager.java:151)
 - waiting to lock <0x00007f46331c6bc8> (a com.atlassian.jira.issue.pager.NextPreviousPager)
 at com.atlassian.jira.issue.pager.PagerManager.updatePager(PagerManager.java:41)
- is a regression of
-
JRASERVER-13296 JiraLuceneFieldCache is not a cache and the synchronized cache code should be removed
-
- Closed
-
- is duplicated by
-
JRASERVER-22719 NextPreviousPager has multi-threaded correctness problems
-
- Closed
-
- causes
-
JDEV-30233 Loading...
- copied to
-
JRADEV-13120 Loading...
- relates to
-
JRADEV-22311 Loading...
