-
Type:
Bug
-
Resolution: Timed out
-
Priority:
Low
-
Component/s: Dashboard - Dashboards & Gadgets
-
5
-
Severity 3 - Minor
Issue Summary
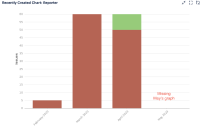
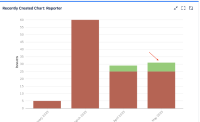
On Dashboards, some Gadgets displays the latest/current month's graph information incorrectly (i.e. appears at the previous month/week) if the user's timezone is based in most American regions, i.e. "America/Mexico City".
Some of the gadgets that have this behavior are the following:
- "Recently created" chart
- "Created vs Resolved" chart
Steps to Reproduce
- Create or Open a Jira Dashboard
- Add a "Recently created" or "Created vs Resolved" Jira chart
- Use a filter that shows issue data from May and set the gadget period to monthly.
- Save the changes.
- Access the Dashboard with an account where its timezone is based in the America region.
Expected Results
The issue data from the current month (May) is correctly displayed on the Chart

Actual Results
The issue data from the current month (May) isn't displayed on the chart; instead, the current month's information appears to be stacked up in the previous month's (April) chart.

Workaround
Change the personal user timezone configuration to a one not based in America region, under id.atlassian.com > Icon profile > Account settings > Local time

