-
Type:
Bug
-
Resolution: Unresolved
-
Priority:
Medium
-
Component/s: Dashboard - Dashboards & Gadgets
-
31
-
Severity 3 - Minor
-
4
Summary
Time to First Response bar graph gadget producing strange results
Steps to Reproduce
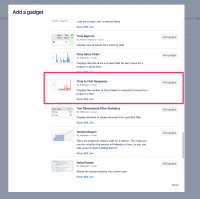
- Configure a Time to First Response bar graph gadget (Jira gadget, not JSD one)
- View the data in the gadget and click on a bar to drill down
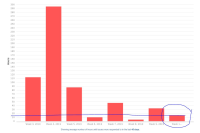
- Notice the drill downed data doesn't seem to relate to the graph
Expected Results
The drill down data reflects whats shown on the gadget
Actual Results
Seemingly unrelated results.
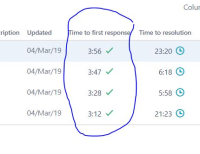
Using the below example and confirming tickets had a comment made, my manual calculations came to an average of ~45m for Time to First Response. The gadget is showing 10 hours.
Notes
Workaround
Use the Service project report gadget and create a TTFR report
- mentioned in
-
Page Loading...


