-
Type:
Bug
-
Resolution: Fixed
-
Priority:
Low
-
Affects Version/s: 7.4.7, 7.11.1
-
Component/s: Macros - Page Properties
-
None
-
1
-
Severity 3 - Minor
Problem
The Page Properties Report macro has a thread pooling mechanism to process asynchronous tasks. Threads in this pool are created with a generic name, such as pool-5-thread-1.
This makes troubleshooting difficult when you need to identify what created these threads.
Environment
N/A
Steps to Reproduce
- Start a Java Flight Recording of the Confluence process
- Add a Page Properties macro in one page
- Add a Page Properties Report macro on another page and fetch the data from the last step
- Load the page containing the Page Properties Report macro
Expected Results
Thread pools are created with a recognizable name.
Actual Results
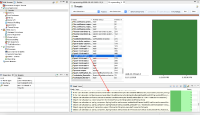
Inspecting the JFR file, we can see that 4 unnamed threads are created for the same pool. Here is a snippet of the stack:
Either com.atlassian.confluence.extra.masterdetail.DetailsSummaryBuilder.renderDetailRows(List, List, boolean, boolean, String) 1
Either com.atlassian.confluence.extra.masterdetail.DetailsSummaryBuilder.lambda$renderDetailRowsWithTransaction$6(List, List, boolean, boolean, String) 1
Object com.atlassian.confluence.extra.masterdetail.DetailsSummaryBuilder$$Lambda$1968.1032140427.doInTransaction()  1
Screenshot of the recording:
Workaround
None
Notes
It is virtually impossible to identify the source of those with thread dumps. This is because such tasks execute quite fast normally, under a few milliseconds. Because of that, such threads appear on thread dumps with the generic stack when they are waiting for another task. This is how you see them:
sun.misc.Unsafe.park(Native Method)
java.util.concurrent.locks.LockSupport.park(LockSupport.java:175)
java.util.concurrent.locks.AbstractQueuedSynchronizer$ConditionObject.await(AbstractQueuedSynchronizer.java:2039)
java.util.concurrent.LinkedBlockingQueue.take(LinkedBlockingQueue.java:442)
java.util.concurrent.ThreadPoolExecutor.getTask(ThreadPoolExecutor.java:1074)
java.util.concurrent.ThreadPoolExecutor.runWorker(ThreadPoolExecutor.java:1134)
java.util.concurrent.ThreadPoolExecutor$Worker.run(ThreadPoolExecutor.java:624)
java.lang.Thread.run(Thread.java:748)
To get a meaningful stack trace, those threads need to be in RUNNABLE state executing a task. This is why JFR is a better tool to identify the origin of such threads since it logs the previously executed tasks with the stack.
