-
Type:
Bug
-
Resolution: Fixed
-
Priority:
Low
-
Affects Version/s: 3.1, 3.1.1, 3.1.2, 3.2, 3.2.1
-
Component/s: None
Steps to reproduce
- Attach both the files attached to this bug report:
- Enter the following in Confluence Page:
h3. Office 2007
{viewfile:star_port_usage_graph.xlsx}
-----
h3. Office 2003
{viewfile:star_port_usage_graph.xls}
Result
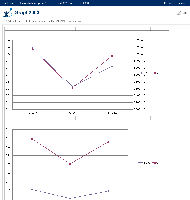
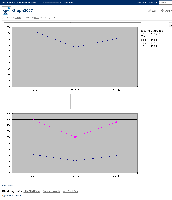
- Office 2007 version of the excel seems to render the chart differently compared with Office 2003 version in Confluence (The right y-axis is missing in 2007 version):
- is incorporated by
-
CONFSERVER-24692 Excel viewfile umbrella issue
-
- Closed
-

