-
Type:
Bug
-
Resolution: Fixed
-
Priority:
Low
-
Affects Version/s: 9.2.6, 8.5.24, 9.5.3
-
Component/s: Search - Indexing, Server - Administration
-
4
-
Severity 3 - Minor
-
45
Issue Summary
If Confluence database's journalentry table has a high enough row count, and if Confluence's JVM heap is not adequately provisioned to handle the extra data, then repeatedly clicking Administration → Content indexing → Content queue or Change queue tabs can cause:
- a pile-up of nearly stalled http threads (which could result in app unresponsiveness)
- a significant spike in heap usage (which could result in crashes with "java.lang.OutOfMemoryError: Java heap space" record in app logs or tomcat logs)
Steps to Reproduce
- On a Confluence instance, induce the insertion of millions of rows in the database's journalentry table (by rapidly creating content, updating content, or by editing permissions on page-trees with thousands of child pages/attachments etc.).
- While the instance is attempting to read entries from the journalentry table, index the referenced content, and flush data to Lucene, click repeatedly on Administration → Content indexing → Content Queue or Change queue.
Expected Results
Content Queue or Change queue should show the items currently queued for processing:
Queued for processing
Items in queue: <NUMBER>
Actual Results
Considering that the objective is to just display the pending items in queue (a set of numbers), the methods executed by Confluence are not performant (they are inefficient).
The operations end up running for long times (sometimes for hours), leaving behind stack traces logged by Tomcat’s StuckThreadDetectionValve in the catalina log like this example:
DD-Mmm-YYYY HH:MM:SS.mmm WARNING [Catalina-utility-4] org.apache.catalina.valves.StuckThreadDetectionValve.notifyStuckThreadDetected Thread [https-jsse-nio2-8443-exec-230 url: /admin/viewcontentindexqueue.action; user: redacted] (id=[279]) has been active for [68,196] milliseconds (since [MM/DD/YY, HH:MM AM/PM]) to serve the same request for [<CONFLUENCE_BASEURL>/admin/viewcontentindexqueue.action] and may be stuck (configured threshold for this StuckThreadDetectionValve is [60] seconds). There is/are [1] thread(s) in total that are monitored by this Valve and may be stuck.
...
...
		at com.atlassian.confluence.impl.journal.HibernateJournalDao.findEntries(HibernateJournalDao.java:75)
...
		at com.atlassian.confluence.impl.journal.DefaultJournalManager.peek(DefaultJournalManager.java:81)
		at com.atlassian.confluence.impl.journal.DefaultJournalService.peek(DefaultJournalService.java:54)
...
		at com.atlassian.confluence.internal.search.queue.AbstractJournalIndexTaskQueue.getQueuedEntries(AbstractJournalIndexTaskQueue.java:97)
		at com.atlassian.confluence.impl.admin.actions.AbstractViewIndexQueueAction.getQueue(AbstractViewIndexQueueAction.java:53)
...
(some variations may be seen in the java classes/methods that show up in the thread’s stack trace)
In extreme circumstances, a high enough row count in the journalentry table (in the multiple millions) can also lead to crash due to "java.lang.OutOfMemoryError: Java heap space" (if the allocated heap is not sized to deal with such eventualities).
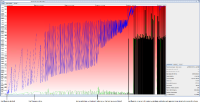
Here’s how the Java Garbage Collection (GC) logs would show the memory inflation:
If this happens on an instance running with the -XX:+HeapDumpOnOutOfMemoryError option enabled, then the resulting heapdump will show:
- a significant chunk of the allocated heap occupied by millions of raw journalentry rows/objects:

- references to viewcontentindexqueue or viewchangeindexqueue as the operations which brought those rows into memory
Workaround
Use the TaskQueueLength value exposed by the Confluence JMX Interface to track the number of items yet to be indexed. That value is the sum of the content and change index items that are yet to be indexed.
The same stat is also printed in the <confluence-local-home>/logs/atlassian-confluence-jmx.log* files, like this sample:
2025-07-23 17:06:02,318 IndexingStatistics: [{"timestamp":"1753254362","label":"IndexingStatistics","objectName":"Confluence:name=IndexingStatistics","attributes":[{"name":"Flushing","value":true},{"name":"LastElapsedMilliseconds","value":9068},{"name":"LastReindexingTaskName","value":null},{"name":"LastStarted","value":1753253600846},{"name":"LastWasRecreated","value":false},{"name":"ReIndexing","value":false},{"name":"TaskQueueLength","value":639654}]}]
(note the "name":"TaskQueueLength","value":639654 part at the end)
Another option is to track the index stats in the <confluence-local-home>/logs/atlassian-confluence-ipd-monitoring.log*:
2025-07-25 15:01:07,886+1000 IPDMONITORING {"timestamp":"1753419667","label":"INDEX.QUEUE.SIZE.VALUE","tags":{"queueName":"edge"},"attributes":{"_value":"4523.0"}}
2025-07-25 15:01:07,886+1000 IPDMONITORING {"timestamp":"1753419667","label":"INDEX.QUEUE.SIZE.VALUE","tags":{"queueName":"change"},"attributes":{"_value":"1497203.0"}}
2025-07-25 15:01:07,886+1000 IPDMONITORING {"timestamp":"1753419667","label":"INDEX.QUEUE.SIZE.VALUE","tags":{"queueName":"main"},"attributes":{"_value":"842799.0"}}
- is a regression of
-
CONFSERVER-66364 Accessing Queue Contents tab can cause an OutOfMemoryError (OOME)
-
- Closed
-
