-
Type:
Bug
-
Resolution: Cannot Reproduce
-
Priority:
 Low
Low
-
Component/s: Macros - Chart
-
1
-
Minor
-
0
Issue Summary
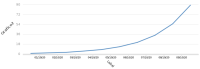
The x-axis isn’t showing the data vertically correctly on Chart macro.
Steps to Reproduce
- Create a new page on Confluence.
- Insert the Chart macro.
- Use the following example:
- Create the table inside the macro:
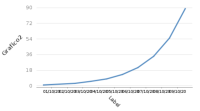
Date Count 01/10/2020 1 02/10/2020 2 03/10/2020 3 04/10/2020 5 05/10/2020 8 06/10/2020 13 07/10/2020 21 08/10/2020 34 09/10/2020 55 10/10/2020 89 - Use the Chart parameters:
Type timeSeries Display Orientation vertical Width 500 Display Chart Data after Horizontal-axis Label Label Horizontal-axis Label Grafico2 Show Legend? Check Time Series? Check Forgive Check Domain Axis Tick Unit 1 Date Tick Mark Position middle
- Create the table inside the macro:
Expected Results
- The x-axis shows the data vertically without scrambling them.

Actual Results
- The x-axis shows the data horizontally scrambling all of them.

Workaround
- Increase the Width Chart macro parameter, so the data will be visible but will keep horizontally.