Uploaded image for project: 'Jira Software Data Center'
  1. Jira Software Data Center
  2. JSWSERVER-1288

As a project manager, I would like to be able to view a burndown chart that clearly communicates changes in scope.

    • Icon: Suggestion Suggestion
    • Resolution: Fixed
    • 6.0.1
    • None
    • None
    • We collect Jira feedback from various sources, and we evaluate what we've collected when planning our product roadmap. To understand how this piece of feedback will be reviewed, see our Implementation of New Features Policy.

      Burndown charts don't do a good job of showing when scope gets added to a project. There are q number of good charting techniques for doing this. See possible examples in fugs 3-23 to 3-26 here:

      http://alistair.cockburn.us/Earned-value+and+burn+charts

      Either add a vertical spike when new stories are added or old stories are re-estimated – or convey the same thing by having the bottom line step down below zero (This is nice because you can get a sense of the total scope addition over time).

          Form Name

            [JSWSERVER-1288] As a project manager, I would like to be able to view a burndown chart that clearly communicates changes in scope.

            The burndown chart in the new GreenHopper boards now display scope change (and explicitly call out scope change in the table below the chart).

            Thanks,
            Shaun

            Shaun Clowes (Inactive) added a comment - The burndown chart in the new GreenHopper boards now display scope change (and explicitly call out scope change in the table below the chart). Thanks, Shaun

            Hello!

            This isn't publicly available, we've been developing this privately. But we've been talking with Atlassians, and there will be something similar inside Greenhopper in the future, as I have understood. We'll be attending on AtlasCamp Europe also and if you're developer we can give hints and ideas

            Regards,
            Tanel

            Tanel Tenso added a comment - Hello! This isn't publicly available, we've been developing this privately. But we've been talking with Atlassians, and there will be something similar inside Greenhopper in the future, as I have understood. We'll be attending on AtlasCamp Europe also and if you're developer we can give hints and ideas Regards, Tanel

            Yes, this would be really nice!

            Tanel, is this available for others to use as well?

            Victor Sollerhed added a comment - Yes, this would be really nice! Tanel, is this available for others to use as well?

            That sounds crazy! Any news on how to get this extended Agile Gadget?

            Xavier GALLERI added a comment - That sounds crazy! Any news on how to get this extended Agile Gadget?

            Thanks for sharing Tanel, great to see!

            Nicholas Muldoon [Atlassian] added a comment - Thanks for sharing Tanel, great to see!

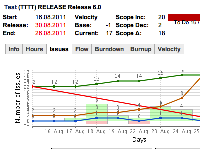
            Or is the green = scope added and the red = scope subtracted?

            This is the case.

            All of the stuff was basically a interesting technical exercise from my point of view. I extended the original GH source and wrote new plugin with this gadget. Over the time other modifications have sneaked in and the final result looks something like this:

            Scope changes are displayed for Burnup and Burndown charts with their applicable values (Estimate Points, etc.) also. I was just too lazy to look for projects which use them to exemplify these charts too.

            I might be able to publish the services performing the calculation. It might take some time, but judging by the interest into this functionality I might speed up a bit

            And as a final sidenote, chart display might not work with the latest version of GH. I wrote my extension for Greenhopper 5.6.

            Tanel Tenso added a comment - Or is the green = scope added and the red = scope subtracted? This is the case. All of the stuff was basically a interesting technical exercise from my point of view. I extended the original GH source and wrote new plugin with this gadget. Over the time other modifications have sneaked in and the final result looks something like this: Scope changes are displayed for Burnup and Burndown charts with their applicable values (Estimate Points, etc.) also. I was just too lazy to look for projects which use them to exemplify these charts too. I might be able to publish the services performing the calculation. It might take some time, but judging by the interest into this functionality I might speed up a bit And as a final sidenote, chart display might not work with the latest version of GH. I wrote my extension for Greenhopper 5.6.

            I would also be very much interested in this burndown with added scope changes.

            Michael Wagner added a comment - I would also be very much interested in this burndown with added scope changes.

            Steve Lane added a comment -

            Hi Tanel – that looks intriguing! Can you tell us what the green and red are? I'm guessing the green is work completed, and the red is added scope? Or is the green = scope added and the red = scope subtracted? Finally, is this work that you could share somehow?

            Steve Lane added a comment - Hi Tanel – that looks intriguing! Can you tell us what the green and red are? I'm guessing the green is work completed, and the red is added scope? Or is the green = scope added and the red = scope subtracted? Finally, is this work that you could share somehow?

            We've extended the original burndown chart gadget and added scope changes. It looks something like this:

            Most difficult part was the scope changes logic, since we can add a issue to Version (change history) and we can create directly issue to Version (value from issue). FYI we didn't created any new customfields and used only the data available from Jira itself.

            Tanel Tenso added a comment - We've extended the original burndown chart gadget and added scope changes. It looks something like this: Most difficult part was the scope changes logic, since we can add a issue to Version (change history) and we can create directly issue to Version (value from issue). FYI we didn't created any new customfields and used only the data available from Jira itself.

            In general, I think Greenhopper should never change past datapoints of charts when you change the scope (add new issues, move existing issues in sscope, or remove issues from scope). See also GHS-1815. The visualisation of scope changes proposed by mountaingoatsoftware (see link added by Nicolas Muldoon) is interesting, because it helps making a difference between scope changes, and changes in estimates.

            Jan De Geeter added a comment - In general, I think Greenhopper should never change past datapoints of charts when you change the scope (add new issues, move existing issues in sscope, or remove issues from scope). See also GHS-1815 . The visualisation of scope changes proposed by mountaingoatsoftware (see link added by Nicolas Muldoon) is interesting, because it helps making a difference between scope changes, and changes in estimates.

              Unassigned Unassigned
              77658968547c Steve Lane
              Votes:
              34 Vote for this issue
              Watchers:
              23 Start watching this issue

                Created:
                Updated:
                Resolved: