Details
-
Bug
-
Resolution: Fixed
-
Medium
-
6.1.2
-
6.01
-
Description
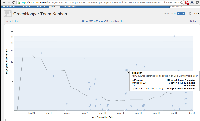
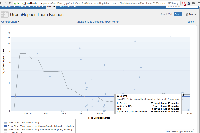
The times for how long an issue has spent in each column (hover info) on the control chart (kanban rapid board) are sometimes wrong.
Looking at the plotted cycle time (dots) and cycle time summary (below chart), everything seems ok, but for some issues the times spent in each column does not make sense.
We are experiencing this a lot in our own project, using simplified workflow.
Attached two screenshots from your own GHS project, so you can perhaps reproduce this quite easy.
Workaround
Report on all columns - hiding them will cause this problem.
Attachments
Issue Links
- is duplicated by
-
JSWSERVER-7685 GreenHopper Control Chart displays wrong values
-
- Closed
-
-
JSWSERVER-7834 Inconsistent column statistics in GreenHopper Control Chart
-
- Closed
-
- is related to
-
JSWSERVER-7685 GreenHopper Control Chart displays wrong values
-
- Closed
-

