Details
-
Bug
-
Resolution: Fixed
-
Medium
-
5.8.6, 5.9.10, 5.8.18, 5.9.12, 6.13.3, 7.2.0
-
41
-
Severity 3 - Minor
-
16
-
Description
Summary
Page tree (left navigation) load times for large spaces becomes increasingly poor as the number of pages in a space increases.
In this instance, the customer has ~60,000 pages in one space and the page tree (left nav) takes ~8 seconds to load consistently.
Other scenarios showed that this might take minutes to load as well.
Environment
- Customer is on Confluence 5.8.18
- Reproduced in Confluence 5.9.12
Steps to Reproduce
- Create a new confluence instance and add a test space
- Create several thousand pages within said space
- In my test instance, I created ~28,000 pages to test
conf=# select count (*) from content where spaceid = '1638415';
 count
-------
 28788
(1 row)
- In my test instance, I created ~28,000 pages to test
- Navigate to a page within the space to observe behavior
Expected Results
- Page tree / left navigation should take a reasonable amount of time to load (2-3 seconds ?)
- Page tree loads simultaneously but asynchronously with page body to reduce total wait time on the page
Actual Results
Upon repro:
- Take note that the page body/contents load quickly, but the page tree (left nav) continues to load for 5-8 more seconds
- Visually, the main page may load quickly, but it is time consuming to move around the space and have to wait on this for every page load

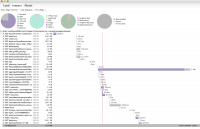
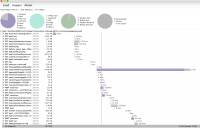
- HAR files show a consistent 7 to 8 second delay in loading the page tree on a space with ~60,000 pages
- HAR files show a consistent 4 to 5 second delay in loading the page tree on a space with ~28,000 pages
It seems to increase with the number of pages in the space, particularly a flat space.
Based on the HAR output, the page tree doesn't begin to load immediately, instead starts 2-3 seconds after initial GET


Logs
These appear to be related:
2016-09-12 16:35:35,010 WARN [http-nio-8000-exec-101] [confluence.util.profiling.DefaultActivityMonitor] close Exceeded the threshold of 60000 ms: ActivitySnapshot{startTime=1473698063212, threadId=239, threadName='http-nio-8000-exec-101', userId='user@example.com', type='web-request', summary='/display/spacename/page+name?src=contextnavpagetreemode'}

2016-09-12 16:35:35,724 WARN [http-nio-8000-exec-13] [confluence.util.profiling.DefaultActivityMonitor] close Exceeded the threshold of 60000 ms: ActivitySnapshot{startTime=1473698066566, threadId=150, threadName='http-nio-8000-exec-13', userId='user@example.com', type='web-request', summary='/display/spacename/page+name?src=contextnavpagetreemode'}

2016-09-12 16:35:39,834 WARN [http-nio-8000-exec-81] [confluence.util.profiling.DefaultActivityMonitor] close Exceeded the threshold of 60000 ms: ActivitySnapshot{startTime=1473698070020, threadId=218, threadName='http-nio-8000-exec-81', userId='user@example.com', type='web-request', summary='/display/spacename/page+name?src=contextnavpagetreemode'}
Workaround
unknown
Attachments
Issue Links
- causes
-
CONFSERVER-54280 Slow Performance in Large Space for Reorder Pages
- Gathering Interest
- is related to
-
CONFSERVER-55392 Pagetree naturalchildren.action permissions lookup can cause a concurrent cache lock and impact Confluence Performance
-
- Closed
-
-
CONFSERVER-56391 Loading the "Reorder Pages" space tool page for very large spaces as a non site-admin user causes CPU spike
-
- Closed
-
- mentioned in
-
Page Loading...
-
Page Loading...
-
Page Loading...
-
Page Loading...
-
Page Loading...
-
Page Loading...
-
Page Loading...
-
Page Loading...
-
Page Loading...
-
Page Loading...
- relates to
-
SAS-306 Loading...
