Uploaded image for project: 'Confluence Data Center'
  1. Confluence Data Center
  2. CONFSERVER-19740

Viewfile of excel chart from Office 2007 is missing some chart information

    XMLWordPrintable

Details

    Description

      Steps to reproduce
      1. Attach both the files attached to this bug report:
      2. Enter the following in Confluence Page:
        h3. Office 2007
        {viewfile:star_port_usage_graph.xlsx}
        -----
        h3. Office 2003
        {viewfile:star_port_usage_graph.xls}
        
      Result
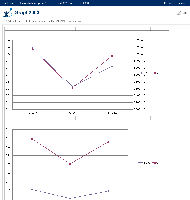
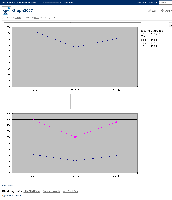
      1. Office 2007 version of the excel seems to render the chart differently compared with Office 2003 version in Confluence (The right y-axis is missing in 2007 version):

      Attachments

        1. Graph2003.png
          Graph2003.png
          52 kB
        2. Graph2007.png
          Graph2007.png
          69 kB
        3. star_port_usage_graph.xls
          41 kB
        4. star_port_usage_graph.xlsx
          15 kB

        Issue Links

          Activity

            People

              rackley RyanA
              sjayaraman Sashidaran Jayaraman [Atlassian]
              Votes:
              5 Vote for this issue
              Watchers:
              5 Start watching this issue

              Dates

                Created:
                Updated:
                Resolved: