• Icon: Suggestion Suggestion
    • Resolution: Answered
    • None
    • None
    • Chrome browser, using Confluence OnDemand, but I suspect this applies to all Confluence environments of the same version.
    • We collect Confluence feedback from various sources, and we evaluate what we've collected when planning our product roadmap. To understand how this piece of feedback will be reviewed, see our Implementation of New Features Policy.

      NOTE: This suggestion is for Confluence Server. Using Confluence Cloud? See the corresponding suggestion.

      While the editor is great, memory consumption on the browser side is unreasonably large in Chrome. If the user only edits once or twice during the life of the browser process, then it's okay. But if you're doing lots of content creation or editing, and therefore using the editor quite a bit, the memory consumption eventually becomes so great that system resources become an issue.

      I can demonstrate this problem by going to any page and clicking Edit, then cancelling to leave the editor. Each time I do this, my Chrome process grows fairly dramatically.

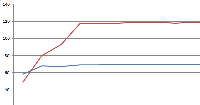
      In an effort to put some numbers around it, I did some testing and created a spreadsheet, and from that I created a chart (attached). The chart illustrates memory consumption (in MB) on IE vs Chrome, for successive editing sessions of the exact same page (a simple page that fits "above the fold")

      That exercise made me realize that the problem is not quite as bad as I thought, because the memory consumption does seem to level off in Chrome on a simple test, in which the same page is being edited again and again.

      It would take me more time than I have right now to do a comprehensive test of a more realistic scenario, but I can assure you that, when you're editing multiple pages, and using multiple browser windows or tabs, you eventually start to get some amazing memory consumption – around half a GB for a single process. This definitely becomes noticeable. And I'm not talking about hundreds of pages over the course of many hours. Just a dozen or so pages for an hour or two, a fairly normal amount of work for an active editor.

      The memory consumption in Chrome is spectacular enough that I was certain this issue would already exist in JIRA. I looked for one pretty hard, but did not find one. If this turns out to be a duplicate, I apologize.

            [CONFSERVER-25659] Significant Memory Consumption in Chrome while Editing

            I see this behavior in Chrome on Fedora Linux today. In my case, I don't even have to do anything. Just viewing a single story will cause the a chrome process to show 16g of memory usage. If I kill the offending chrome process, the Jira tab is impacted.

            Version 88.0.4324.150 (Official Build) (64-bit), Fedora 33.

            David Cathey added a comment - I see this behavior in Chrome on Fedora Linux today. In my case, I don't even have to do anything. Just viewing a single story will cause the a chrome process to show 16g of memory usage. If I kill the offending chrome process, the Jira tab is impacted. Version 88.0.4324.150 (Official Build) (64-bit), Fedora 33.

            Jan Jebavy added a comment -

            I dont understand. How is this "answered" exactly? I have the same problem and a lesson about Chrome memory management does not really help with Confluence page editor taking up all system resources. 

            Jan Jebavy added a comment - I dont understand. How is this "answered" exactly? I have the same problem and a lesson about Chrome memory management does not really help with Confluence page editor taking up all system resources. 

            I had the issue with JIRA and Chrome on a Win 7 PC: doing a sprint planning session the memory of the chrome process for that tab raised to over 1 GB, making me wait for simple change of estimate figure for 4-5 minutes!

            Any plan or hit to avoid this problem?

            Regina Preysing added a comment - I had the issue with JIRA and Chrome on a Win 7 PC: doing a sprint planning session the memory of the chrome process for that tab raised to over 1 GB, making me wait for simple change of estimate figure for 4-5 minutes! Any plan or hit to avoid this problem?

            art taylor added a comment -

            This is still an issue with Chrome 27 on OS X. The tab process consumes about 1GB and must be killed. Creating a new tab and continuing work will be much faster but that process too will soon reach the 1GB threshold.

            art taylor added a comment - This is still an issue with Chrome 27 on OS X. The tab process consumes about 1GB and must be killed. Creating a new tab and continuing work will be much faster but that process too will soon reach the 1GB threshold.

            Thanks for the detailed responses. I should have mentioned I was on Windows, but I guess the implication is there, because I'm testing godforsaken IE

            So while this issue is indeed "answered" to some degree, I'm about to roll out Confluence to my enterprise, and there's no doubt in my mind that Chrome (on Windows, anyway) must be restarted from time to time due to significant memory usage that does not appear to stop growing. I mentioned this in the description, but admittedly I don't have robust documentation of this. I'll find a way to generate the memory consumption data over time organically, so I can do my normal work and report the actual growth in memory consumption.

            Having said that, I appreciate the insight into the different ways one can perceive process memory reporting. Ultimately, though, my problem remains: You should be able to run the Confluence editor over and over again, indefinitely, on all supported browsers, and that's not my reality on Windows with Chrome. I'll let you know what I find out.

            John Ingram added a comment - Thanks for the detailed responses. I should have mentioned I was on Windows, but I guess the implication is there, because I'm testing godforsaken IE So while this issue is indeed "answered" to some degree, I'm about to roll out Confluence to my enterprise, and there's no doubt in my mind that Chrome (on Windows, anyway) must be restarted from time to time due to significant memory usage that does not appear to stop growing. I mentioned this in the description, but admittedly I don't have robust documentation of this. I'll find a way to generate the memory consumption data over time organically, so I can do my normal work and report the actual growth in memory consumption. Having said that, I appreciate the insight into the different ways one can perceive process memory reporting. Ultimately, though, my problem remains: You should be able to run the Confluence editor over and over again, indefinitely, on all supported browsers, and that's not my reality on Windows with Chrome. I'll let you know what I find out.

            Just wanted to report back that on OSX after the initial load of an edit page if I just refresh over and over I'm not seeing the performance characteristic that's indicated by the graph.

            If I load the same edit page in multiple tabs the Google Chrome Task manager does report and increase in memory usage but nothing beyond what I wouldn't expect from multiple processes all running the same thing (same page).

            wwalser (Inactive) added a comment - Just wanted to report back that on OSX after the initial load of an edit page if I just refresh over and over I'm not seeing the performance characteristic that's indicated by the graph. If I load the same edit page in multiple tabs the Google Chrome Task manager does report and increase in memory usage but nothing beyond what I wouldn't expect from multiple processes all running the same thing (same page).

            Really cool data John. I appreciate you looking into it though I'm afraid you probably looked because you noticed a problem. Sorry if that's the case.

            Can I ask where you're getting the numbers from? If you're on Windows, the task manager is unreliable for checking Chrome's memory usage. (sorry if you know all of this) Chrome is a multi-process browser and if you count the memory per-process you end up double counting shared memory. Chrome is fairly aggressive about it's use of shared memory in order to cache what it can, counting from the task manager can increase your totals by 30-40%[1]. All of that being said, it sounds like your graphs are for a single tab loading the same site over and over. That would indicate a single process to me unless you were opening/cloasing tabs for each edit.

            In the middle of reading your comment my thought was "Oh crap we have an epic memory leak somewhere" but with the flatline that you also pointed out that doesn't seem to be the case. Chrome is clearly capable of freeing this memory which as Craig pointed out sounds like caching. We do use a lot of javascript resources (which would be the most reasonable thing to cache), do you see similar performance metrics out of other javascript heavy web applications, gmail would probably be a reasonable candidate.

            Right now I'm bouncing around the web trying to find out if Chrome's per-tab sandbox puts a memory limit on individual tabs. This would be a reasonable thing for them to do. If this is the case they might not GC some cacheable resources until that limit is reached. I'll write back if my investigation turns up anything new. I'll also have a run at your test case on my computer and see if I have similar results.

            Thanks!

            1. http://blog.chromium.org/2008/09/google-chrome-memory-usage-good-and-bad.html

            wwalser (Inactive) added a comment - Really cool data John. I appreciate you looking into it though I'm afraid you probably looked because you noticed a problem. Sorry if that's the case. Can I ask where you're getting the numbers from? If you're on Windows, the task manager is unreliable for checking Chrome's memory usage. (sorry if you know all of this) Chrome is a multi-process browser and if you count the memory per-process you end up double counting shared memory. Chrome is fairly aggressive about it's use of shared memory in order to cache what it can, counting from the task manager can increase your totals by 30-40% [1] . All of that being said, it sounds like your graphs are for a single tab loading the same site over and over. That would indicate a single process to me unless you were opening/cloasing tabs for each edit. In the middle of reading your comment my thought was "Oh crap we have an epic memory leak somewhere" but with the flatline that you also pointed out that doesn't seem to be the case. Chrome is clearly capable of freeing this memory which as Craig pointed out sounds like caching. We do use a lot of javascript resources (which would be the most reasonable thing to cache), do you see similar performance metrics out of other javascript heavy web applications, gmail would probably be a reasonable candidate. Right now I'm bouncing around the web trying to find out if Chrome's per-tab sandbox puts a memory limit on individual tabs. This would be a reasonable thing for them to do. If this is the case they might not GC some cacheable resources until that limit is reached. I'll write back if my investigation turns up anything new. I'll also have a run at your test case on my computer and see if I have similar results. Thanks! 1. http://blog.chromium.org/2008/09/google-chrome-memory-usage-good-and-bad.html

            Petch (Inactive) added a comment - - edited

            Edit / save should do a page reload, which should release all resources in the Browser (this is not always the case due to leaks in the browser itself).

            That fact that it flatlines seems to show at least there's not a memory leak in Chrome. So I suspect that Chrome is just caching much more than IE.

            A Chrome extension may use additional memory too if any are installed (though that's just speculation).

            I'm not sure if Chrome can be tuned to cache less or not (I didn't find anything when I did a quick google search - though I may not have used the right keywords).

            Petch (Inactive) added a comment - - edited Edit / save should do a page reload, which should release all resources in the Browser (this is not always the case due to leaks in the browser itself). That fact that it flatlines seems to show at least there's not a memory leak in Chrome. So I suspect that Chrome is just caching much more than IE. A Chrome extension may use additional memory too if any are installed (though that's just speculation). I'm not sure if Chrome can be tuned to cache less or not (I didn't find anything when I did a quick google search - though I may not have used the right keywords).

              Unassigned Unassigned
              43899b9d996e John Ingram
              Votes:
              0 Vote for this issue
              Watchers:
              9 Start watching this issue

                Created:
                Updated:
                Resolved: