Details
-
Bug
-
Resolution: Fixed
-
Low
-
1.0-rc2
-
None
-
1.0rc2 standalone / linux / jdk 1.5.0_11
Description
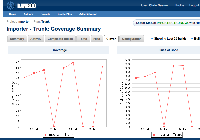
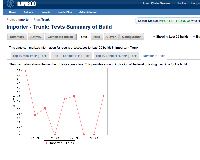
See attached screenshot.
On days that a build does not occur, the clover charts show 0% coverage. This creates the false perception that somehow the test coverage actually went to 0% on those days, which is of course not the case.
Expected behavior: on days where builds do not happen, the test coverage stays constant in the chart.
Steps to replicate:
1) Set up a new project and build plan for a codebase that is integrated with Clover. Make sure that the project has greater than 0% coverage. For example sake, we'll say that initial coverage is at 50%.
2) On day one, build the project. Notice the clover chart shows 50% coverage
3) On day two, do not build the project. Notice the clover chart drops to 0% coverage (lines of code chart goes to 0 too)
4) On day three, without making any modifications to the code, manually build the project. Notice that the coverage and lines of code charts jump right back to their previous values.

